
DECATUR — Electrician Samuel Ward is the latest name to be etched in memory and granite on the Macon County Worker’s Memorial which stands in the grounds of the Macon County Courthouse.

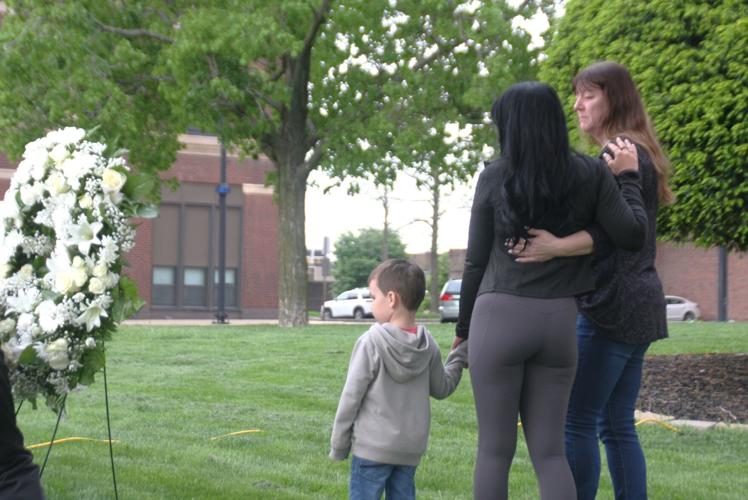
The family of Samuel Ward laid the wreath at the Workers' Memorial Day commemoration on Tuesday, April 28, in Decatur. From left, Ward's 4-year-old son Sterling with mom, Renee, and Samuel Ward's mother, Angela. Samuel Ward, a union electrician, died in November while working at the Clinton Power Plant.
People are also reading…
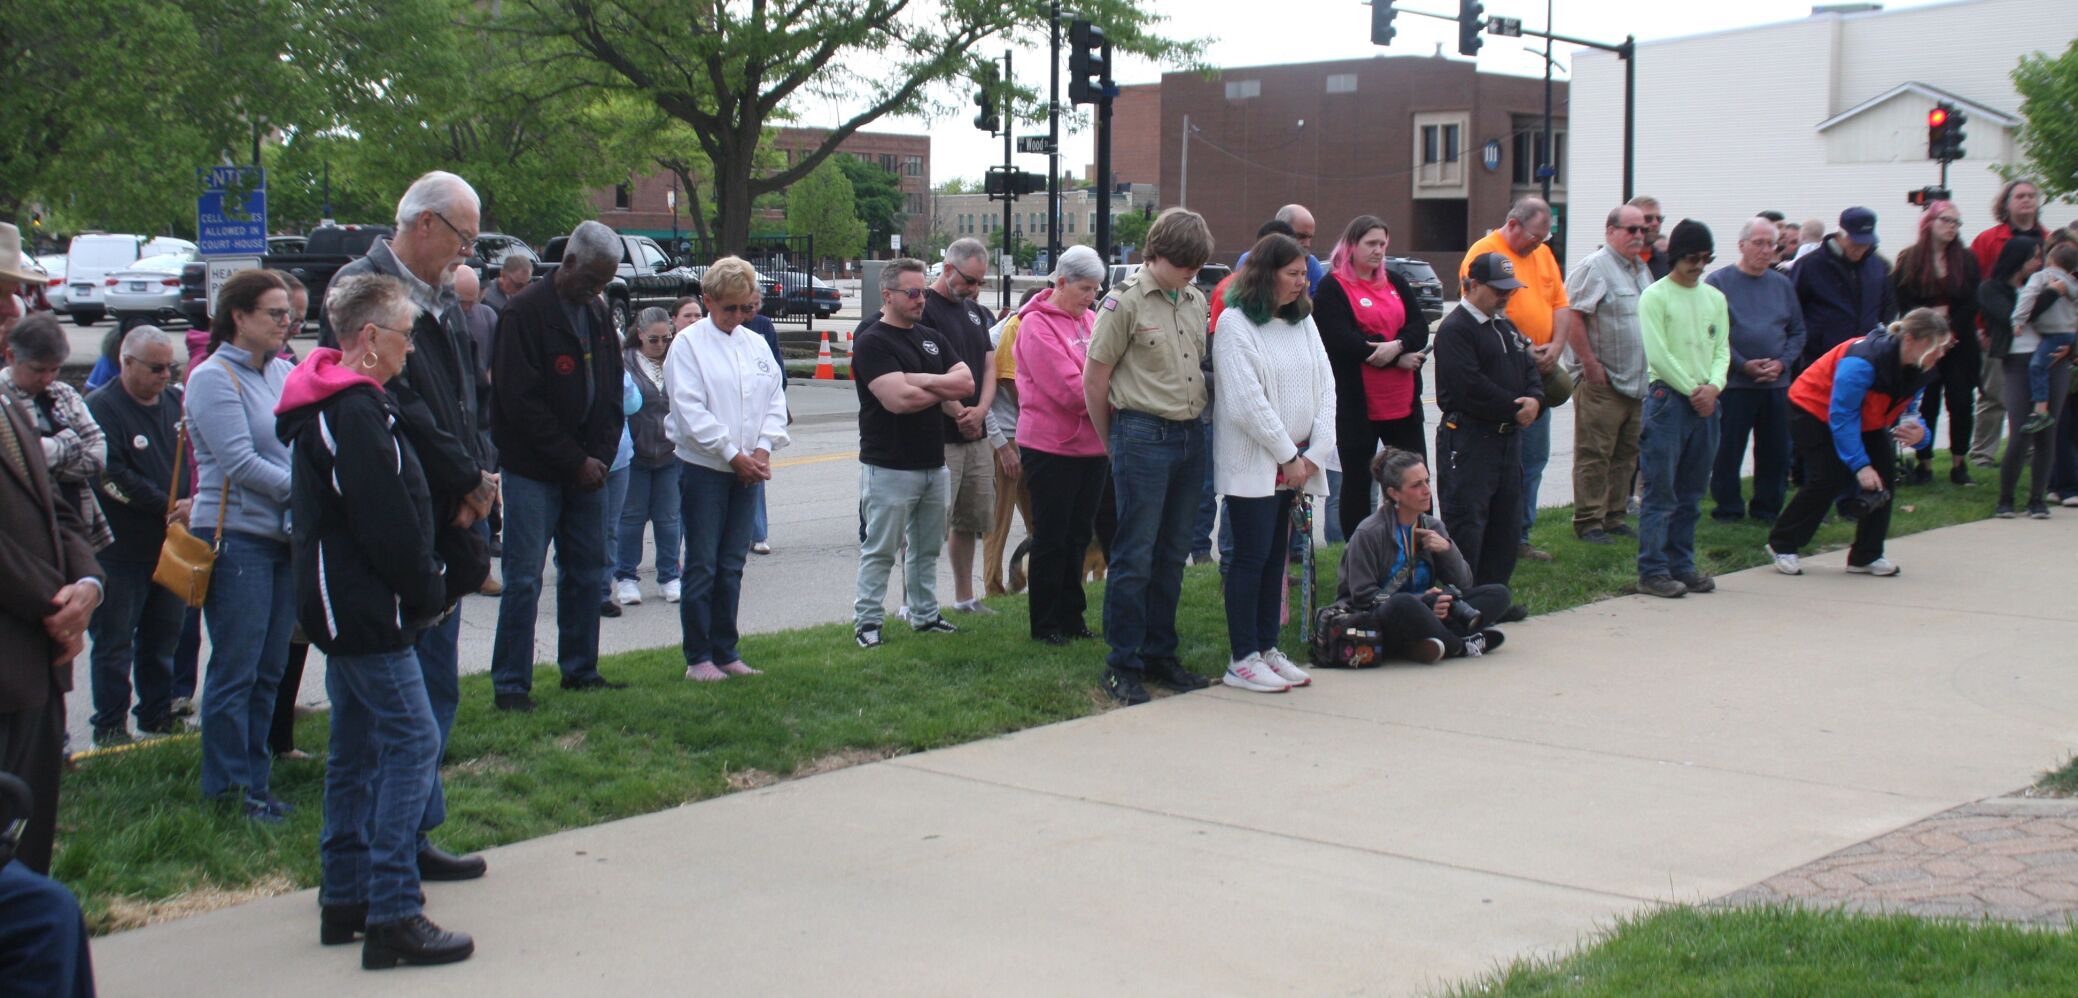
Their heads bent in prayer, some of the crowd present for Workers' Memorial Day commemoration on Tuesday, April 28, held in front of the black granite Workers Memorial monument in front of the Macon County Courthouse.
More danger, more pay? America’s 15 deadliest jobs
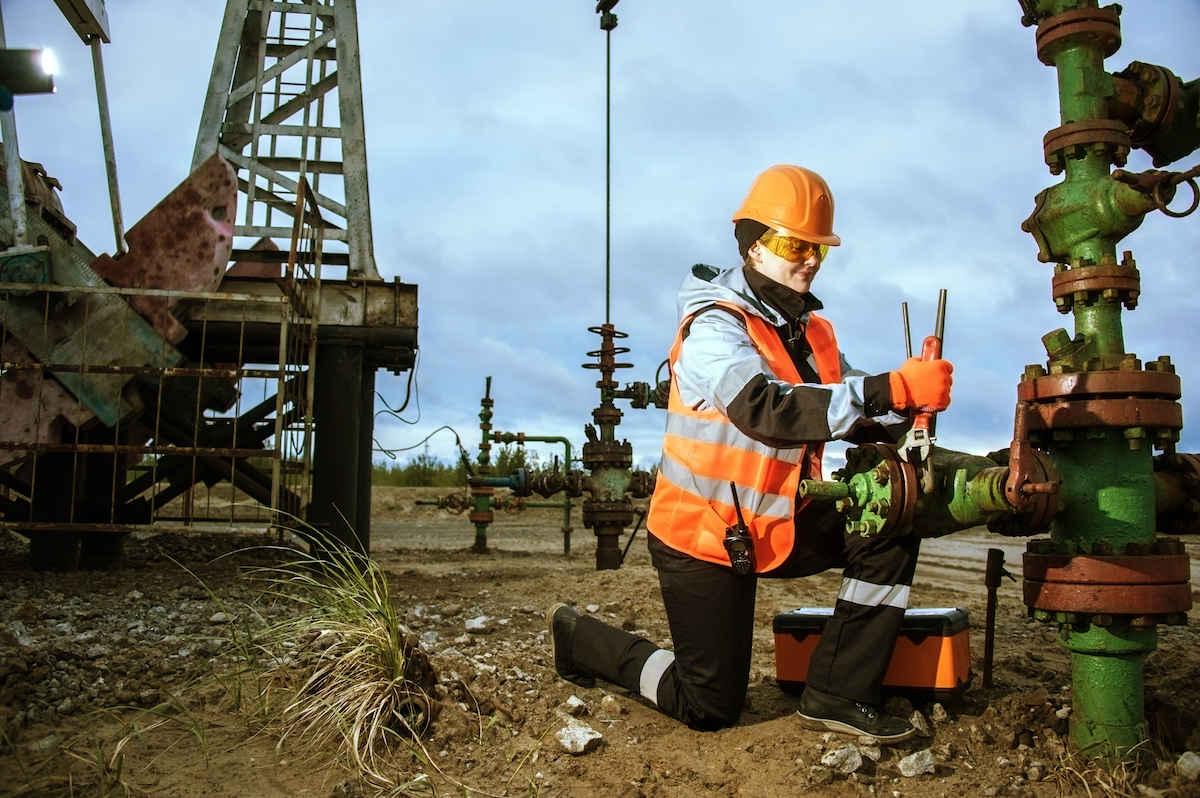
Intro
 Credit: Shutterstock / Tawansak
Data on fatalities in the workplace is meticulously gathered to ensure that federal, state, and local safety standards are upheld across the country. Each year, Bureau of Labor Statistics (BLS) collects statistics on fatal injuries in the workplace across a wide variety of occupations and industries. In 2016, the nation’s workforce saw 5,190 fatal injuries that occurred “on the job,” amounting to a rate of about 3.6 deaths per 100,000 employed workers who worked regular hours.
Methodology
The data scientists at Insurify, an insurance quote comparison website, compiled data from the Bureau of Labor Statistics (BLS) on fatal injury rates, the number of fatal injuries, and average annual salaries per occupation in the year 2016. They took the analysis a step further by determining the likelihood of experiencing a fatal injury on the job indexed against the national average (a rate of 3.6 fatal injuries per 100,000 equivalent full-time workers, as calculated by the BLS), and by comparing the average annual mean wage of all of the ranked jobs that require less than a bachelor’s degree to the most recent estimates of the average annual income of all workers with just a high school diploma or equivalent. Information on educational requirements was taken from the BLS and MyNextMove.
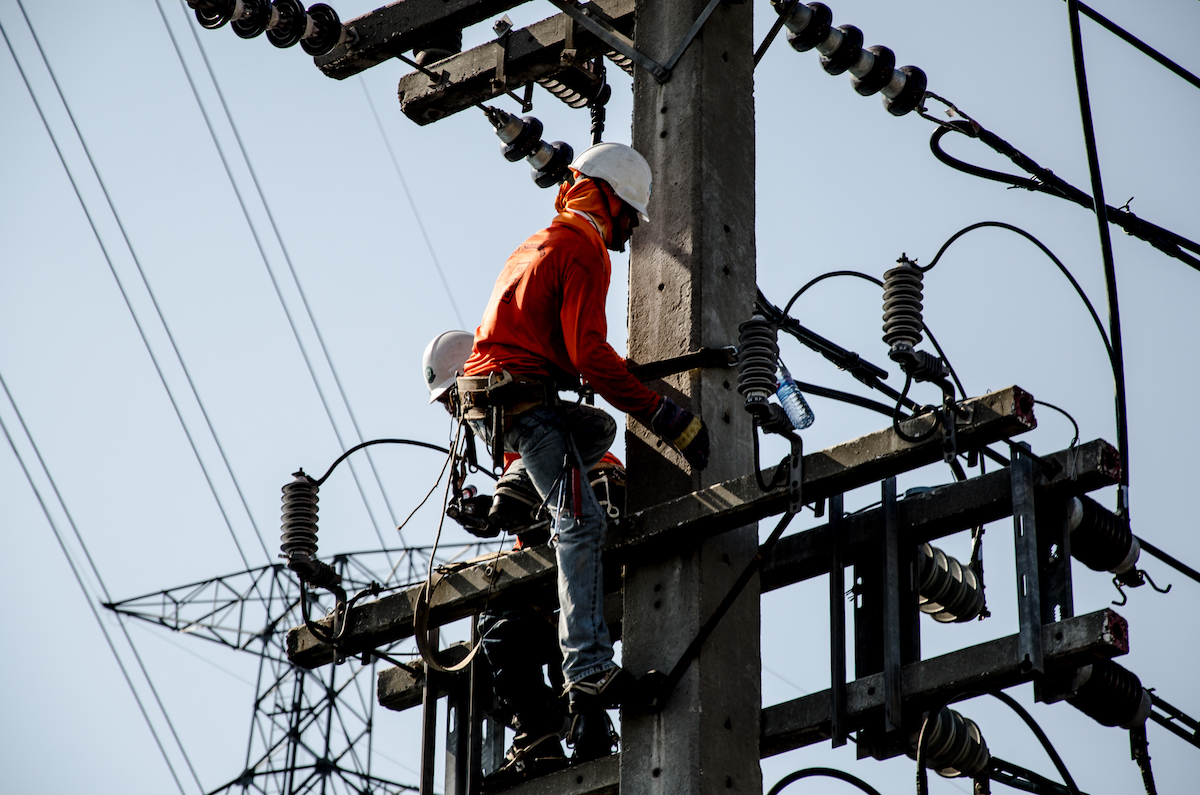
15. Electrical power-line installers and repairers
 Credit: Shutterstock / Sawat Banyenngam
- Fatal injury rate: 14.6 per 100k
- Fatal injuries per year: 21
- Most common cause of fatal injury: Exposure to harmful substances or environments
- Mean annual salary: $68,710
- Educational requirements: High school diploma or equivalent
- 4 times more likely to have a fatal injury than the average worker
14. Police and sheriff's patrol officers
 Credit: Shutterstock / LightField Studios
- Fatal injury rate: 14.6 per 100k
- Fatal injuries per year: 108
- Most common cause of fatal injury: Violence and other injuries by persons or animals
- Mean annual salary: $64,490
- Educational requirements: High school diploma or equivalent, or college coursework/degree, and training
- 4 times more likely to have a fatal injury than the average worker
13. Construction laborers
 Credit: Shutterstock / Dmitry Kalinovsky
- Fatal injury rate: 15.1 per 100k
- Fatal injuries per year: 254
- Most common cause of fatal injury: Falls, slips, and trips
- Mean annual salary: $38,890
- Educational requirements: High school diploma or equivalent, training, and certain licenses, certifications, and registrations may be required
- 4 times more likely to have a fatal injury than the average worker
12. First-line supervisors of mechanics, installers, and repairers
 Credit: Shutterstock / ALPA PROD
- Fatal injury rate: 15.7 per 100k
- Fatal injuries per year: 44
- Most common cause of fatal injury: Violence and other injuries by persons or animals
- Mean annual salary: $68,120
- Educational requirements: High school diploma or equivalent
- 4 times more likely to have a fatal injury than the average worker
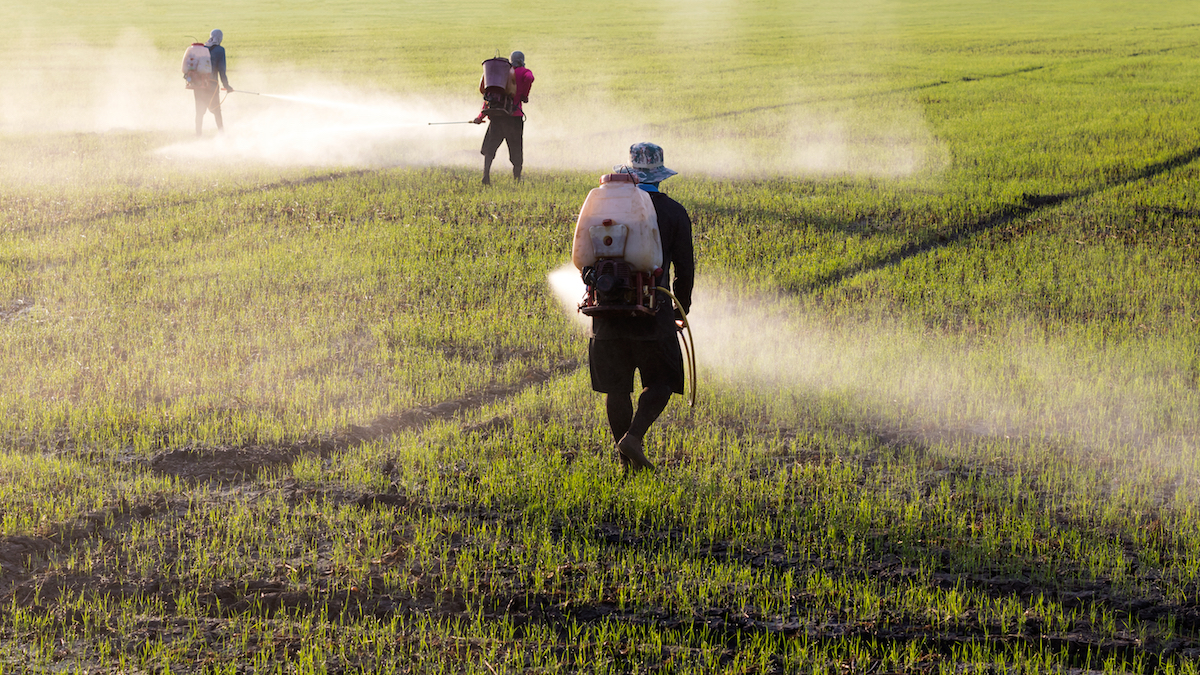
11. Miscellaneous agricultural workers
 Credit: Shutterstock / Keantian Street
- Fatal injury rate: 17.4 per 100k
- Fatal injuries per year: 156
- Most common cause of fatal injury: Transportation incidents
- Mean annual salary: $25,990
- Educational requirements: High school diploma or equivalent and some licenses, certifications, and registrations may be required
- 5 times more likely to have a fatal injury than the average worker
9. First-line supervisors of construction trades and extraction workers
 Credit: Shutterstock / ded pixto
- Fatal injury rate: 18.0 per 100k
- Fatal injuries per year: 134
- Most common cause of fatal injury: Transportation incidents
- Mean annual salary: $69,200
- Educational requirements: Bachelor’s degree
- 5 times more likely to have a fatal injury than the average worker
8. Farmers, ranchers, and other agricultural managers
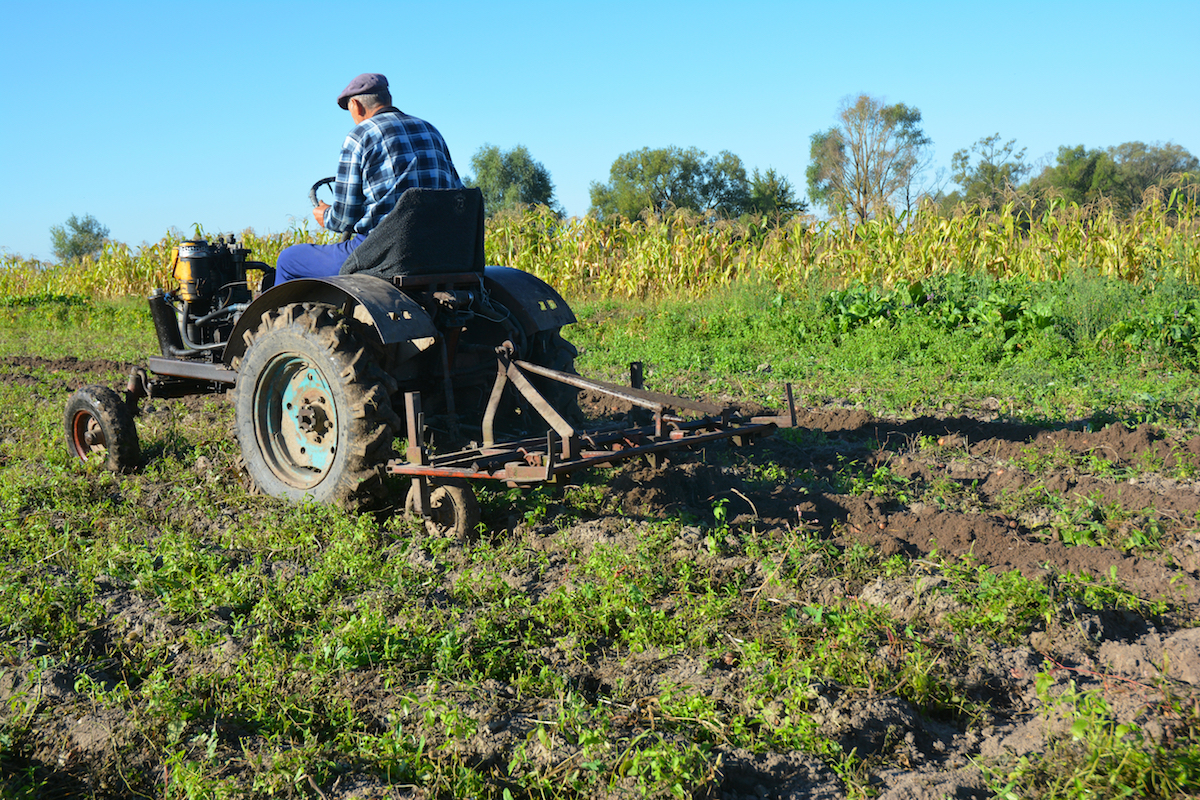 Credit: Shutterstock / Radovan1
- Fatal injury rate: 23.1 per 100k
- Fatal injuries per year: 260
- Most common cause of fatal injury: Transportation incidents
- Mean annual salary: $80,320
- Educational requirements: High school diploma or equivalent
- 6 times more likely to have a fatal injury than the average worker
7. Driver/sales workers and truck drivers
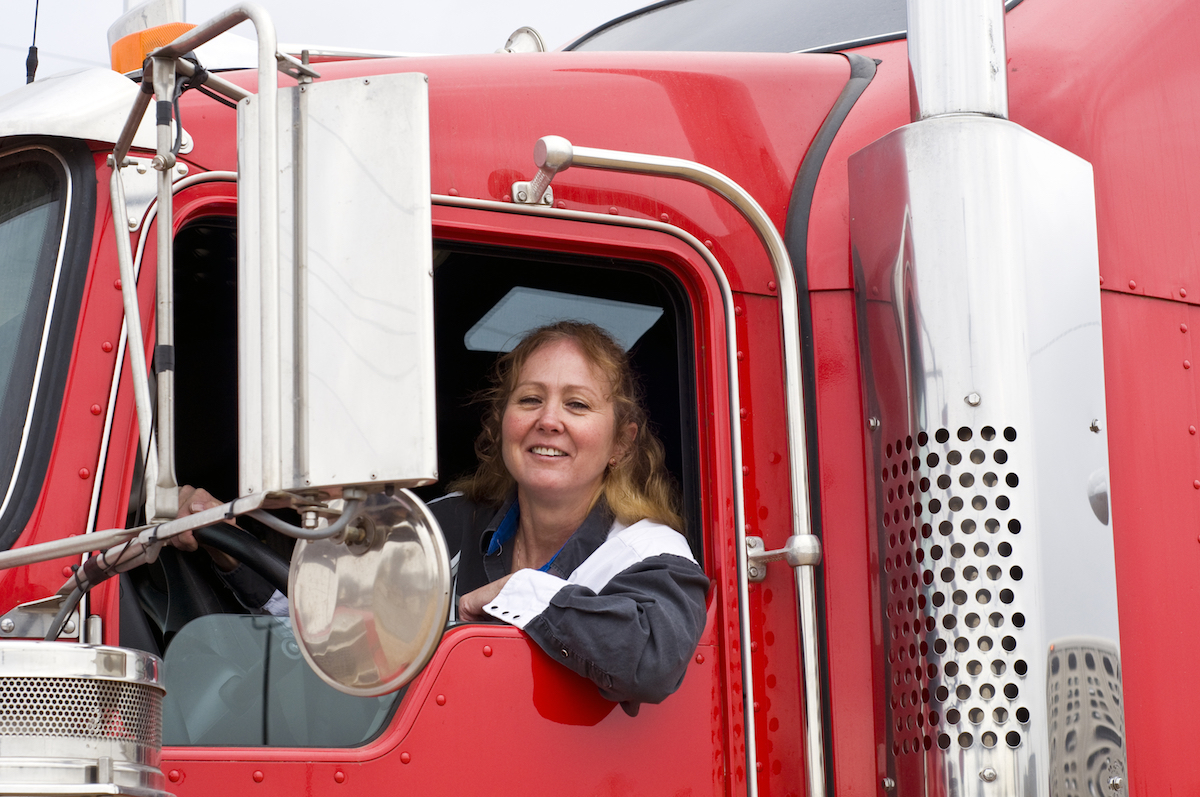 Credit: Shutterstock / rCarner
- Fatal injury rate: 24.7 per 100k
- Fatal injuries per year: 918
- Most common cause of fatal injury: Transportation incidents
- Mean annual salary: $39,790
- Educational requirements: High school diploma or equivalent
- 7 times more likely to have a fatal injury than the average worker
6. Structural iron and steel workers
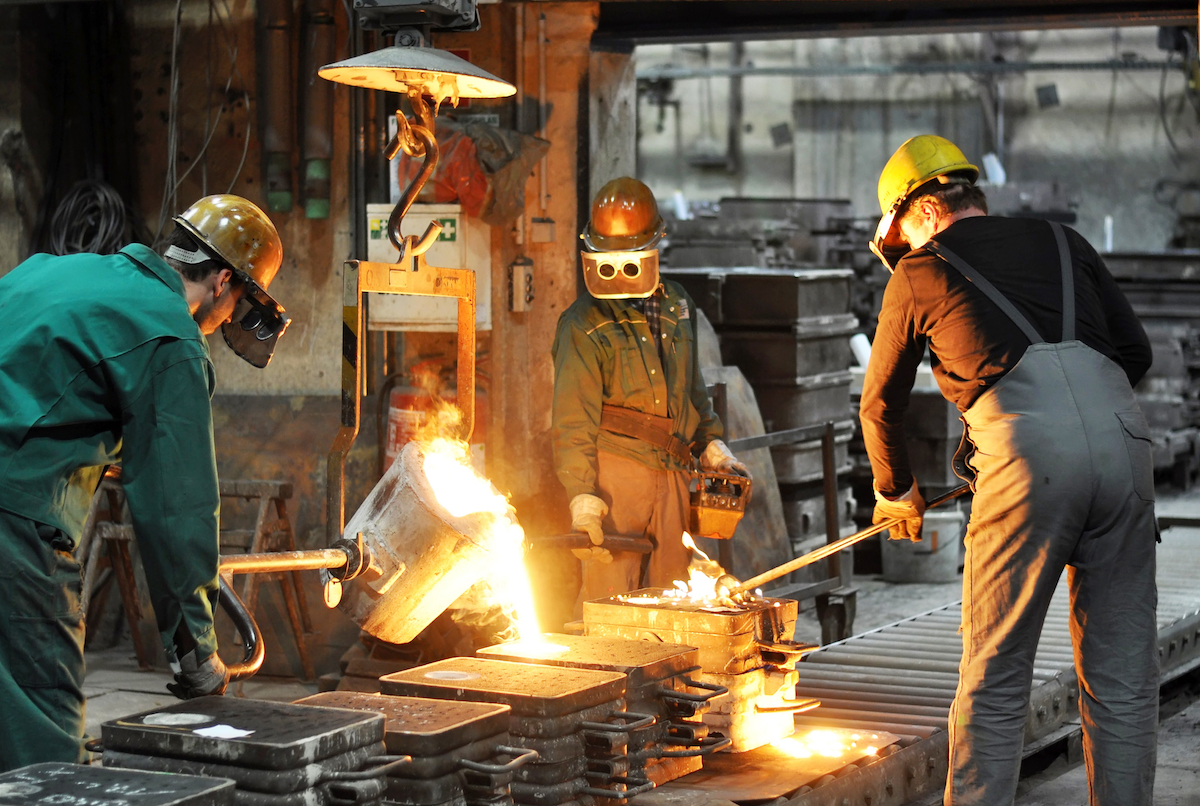 Credit: Shutterstock / industryviews
- Fatal injury rate: 25.1 per 100k
- Fatal injuries per year: 16
- Most common cause of fatal injury: Falls, slips, and trips
- Mean annual salary: $56,940
- Educational requirements: High school diploma or equivalent
- 7 times more likely to have a fatal injury than the average worker
5. Refuse and recyclable material collectors
 Credit: Shutterstock / Dmitry Kalinovksy
- Fatal injury rate: 34.1 per 100k
- Fatal injuries per year: 31
- Most common cause of fatal injury: Transportation incidents
- Mean annual salary: $38,920
- Educational requirements: No formal educational credential
- 9 times more likely to have a fatal injury than the average worker
4. Roofers
 Credit: Shutterstock / brizmaker
- Fatal injury rate: 48.6 per 100k
- Fatal injuries per year: 101
- Most common cause of fatal injury: Falls, slips, and trips
- Mean annual salary: $42,780
- Educational requirements: No formal educational credential
- 14 times more likely to have a fatal injury than the average worker
3. Aircraft pilots and flight engineers
 Credit: Shutterstock / l i g h t p o e t
- Fatal injury rate: 55.5 per 100k
- Fatal injuries per year: 75
- Most common cause of fatal injury: Transportation incidents
- Mean annual salary: $138,690
- Educational requirements: Bachelor’s degree (or high school diploma or equivalent); pilot’s license; ATP certificate; training; work experience; other licenses, certifications, and registrations
- 15 times more likely to have a fatal injury than the average worker
2. Fishers and related fishing workers
 Credit: Shutterstock / photomatz
- Fatal injury rate: 86.0 per 100k
- Fatal injuries per year: 24
- Most common cause of fatal injury: Transportation incidents
- Mean annual salary: $31,190
- Educational requirements: No formal educational credential
- 24 times more likely to have a fatal injury than the average worker
1. Logging workers
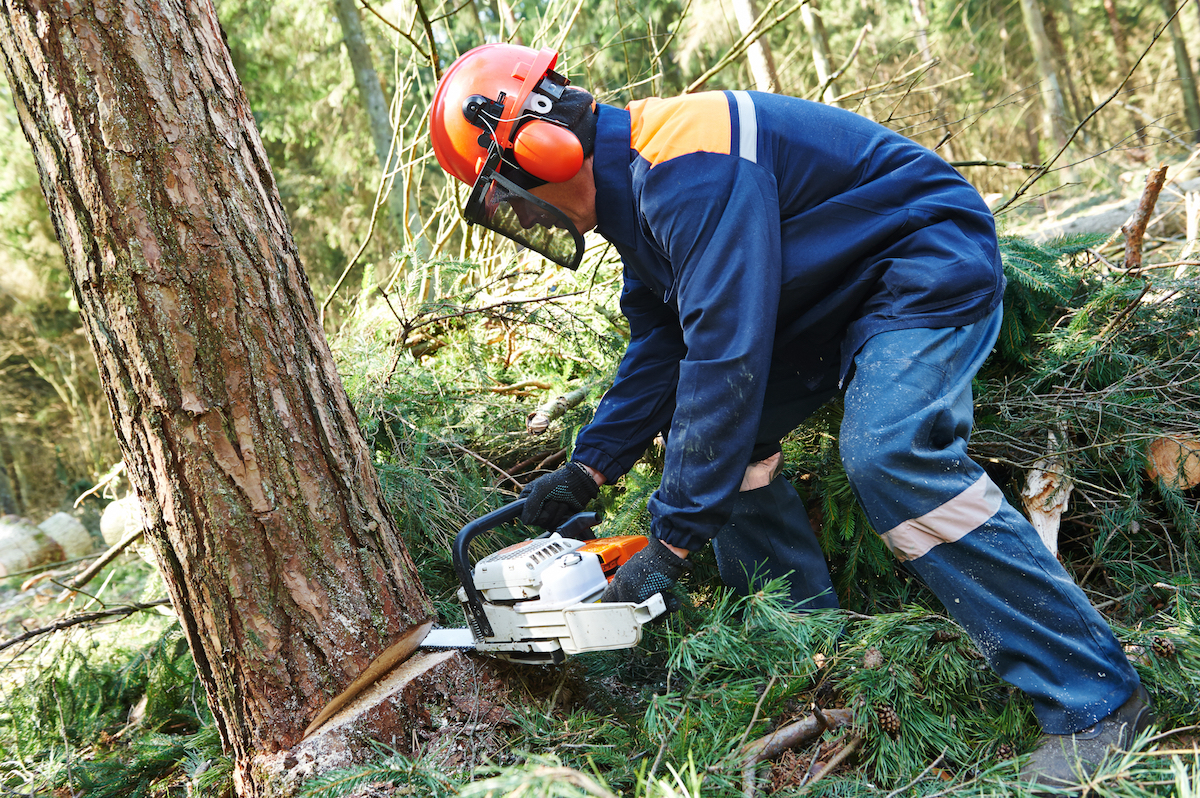 Credit: Shutterstock / Dmitry Kalinovsky
- Fatal injury rate: 135.9 per 100k
- Fatal injuries per year: 91
- Most common cause of fatal injury: Contact with objects and equipment
- Mean annual salary: $40,830
- Educational requirements: High school diploma or equivalent
- 38 times more likely to have a fatal injury than the average worker
Contact Tony Reid at (217) 421-7977. Follow him on Twitter: @TonyJReid

Tony Reid
Macon County Courts Reporter